Ultrasound enters
A transabdominal or transvaginal image is standardized to a 512 × 512 model input.
 OvaScope AIUltrasound Intelligence
A presentation-ready object-detection workflow that identifies and localizes eight ovarian ultrasound categories using an EfficientDet-D0 backbone and augmented 512 × 512 imaging data.
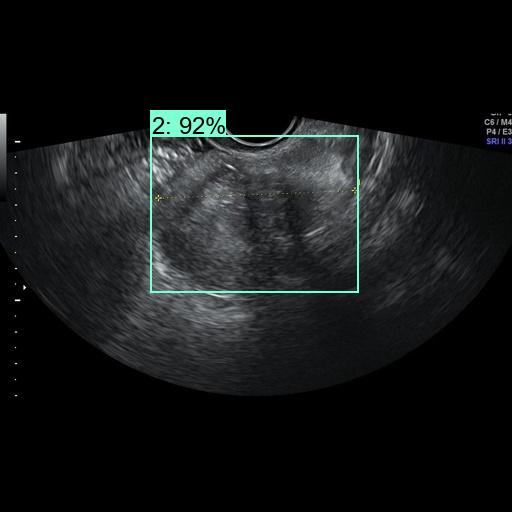
The system is not drawing a full pixel mask. It performs object detection: it finds a suspicious region, places a box around it, assigns one of eight categories, and reports a confidence score.
A transabdominal or transvaginal image is standardized to a 512 × 512 model input.
EfficientDet combines multi-scale visual features so both large cystic areas and smaller focal findings can be considered.
The detector proposes regions and suppresses overlapping duplicates through non-maximum suppression.
Each retained region receives a category label and confidence; the demo threshold is configurable around 0.40.
Play through representative model outputs. Every ultrasound is displayed with contain-fit framing, so the complete source image remains visible.
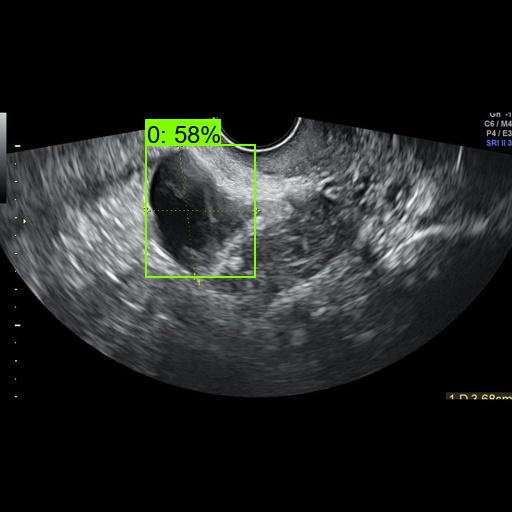
A blood-filled endometriotic cyst candidate localized by the detector.
The source outputs use numeric IDs. This presentation translates them into readable clinical category names.
Endometrioma-like cystic finding.
3,136 training objectsTypically benign epithelial cystic tumor.
2,212 training objectsMixed echogenic appearance candidate.
3,080 training objectsSex-cord stromal tumor candidate.
756 training objectsThin-walled, fluid-filled cystic pattern.
812 training objectsNon-tumor ovarian appearance.
2,492 training objectsMultiloculated mucinous-pattern candidate.
868 training objectsHigh-risk malignant-pattern candidate.
644 training objectsDrag the divider. The left side is the original ultrasound; the right side is the model output with its localized region and label.
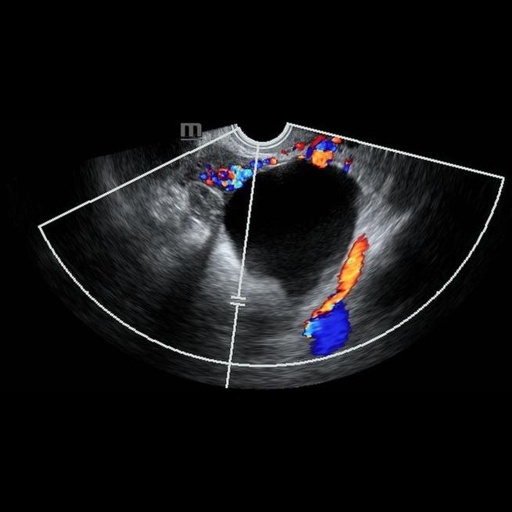
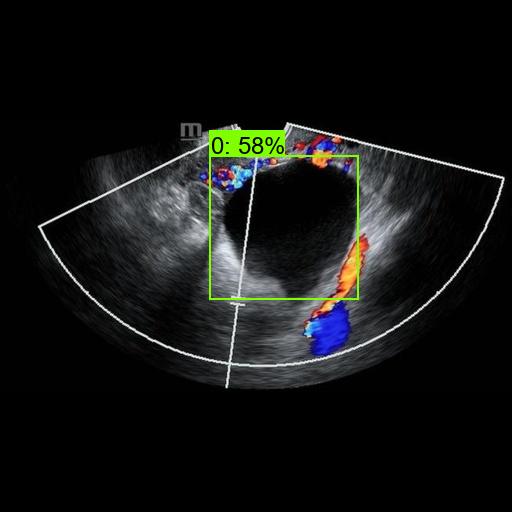
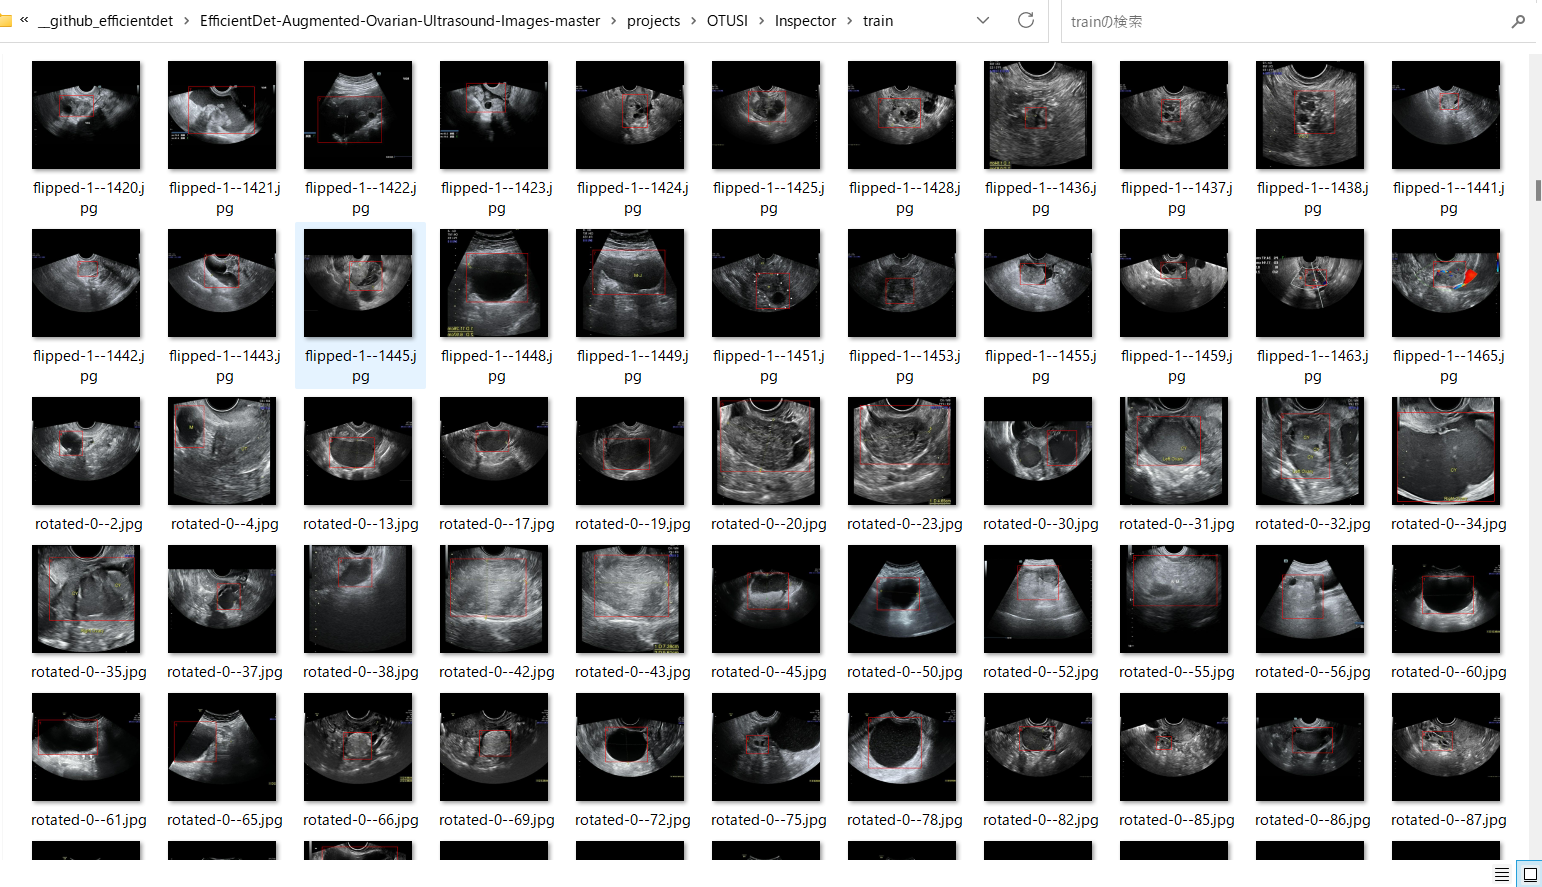
The moving viewport scans across the repository’s annotated training contact sheet. It demonstrates the variety of acquisition angles, lesion sizes, probe shapes, grayscale patterns and bounding-box scales presented to the model.
The reported numbers indicate a useful experimental prototype, but also clear headroom before clinical deployment.
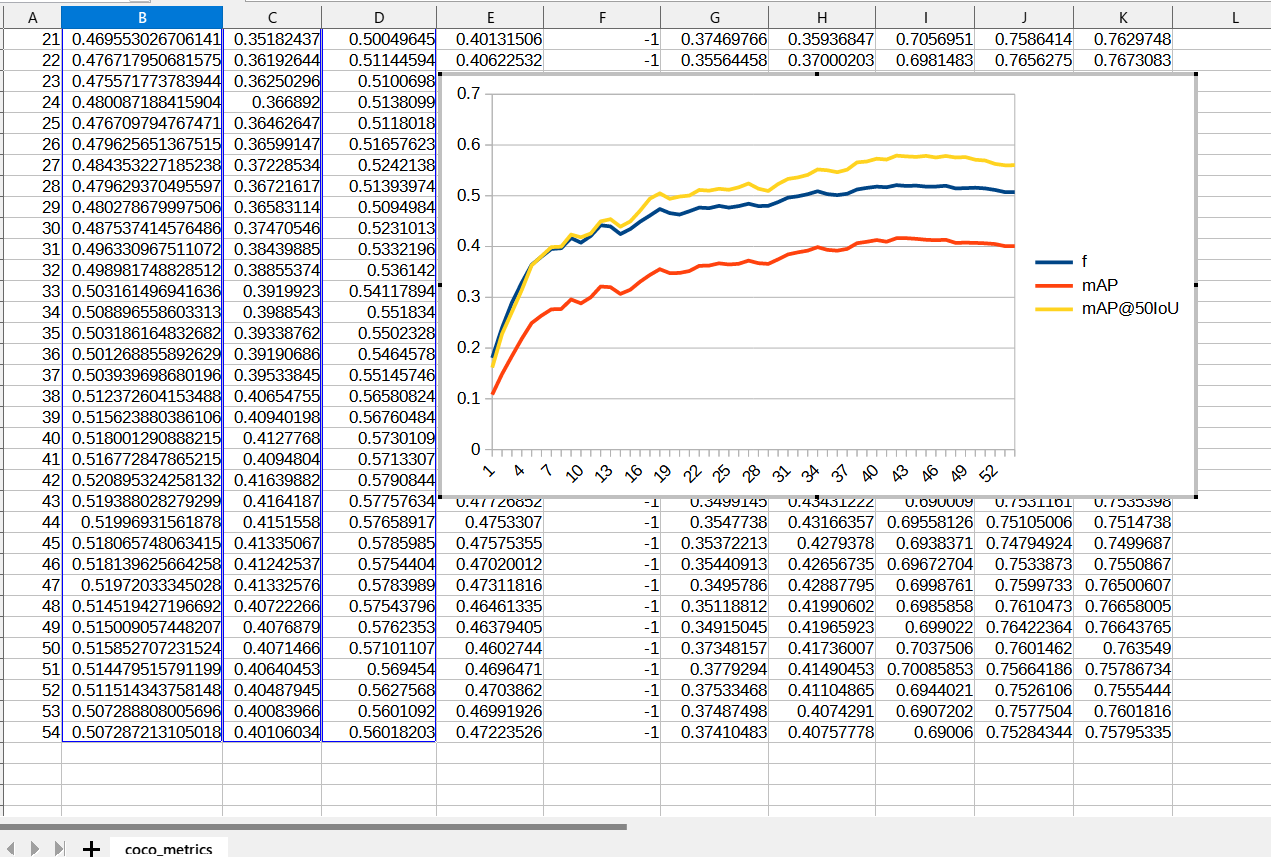
Validation F-score and COCO mAP across 54 epochs.
At epoch 54, AP ranges from about 0.60 for class 0 to about 0.06 for class 4. That gap can reflect limited examples, overlapping ultrasound appearances, annotation variation and model capacity. The right next step is not to hide the weakness—it is to expand balanced data, add expert review and validate on external scanners.
Surface candidate regions after image capture while keeping the clinician in control.
Store box coordinates, predicted category and confidence with each review case.
Compare model output with expert annotations for training and retrospective quality review.
Capture expert corrections to build a better, balanced, scanner-diverse validation dataset.
OvaScope AI turns a complex detection repository into a polished, understandable presentation experience.