AI-ASSISTED BONE TUMOR HISTOLOGY
Turn H&E tissue tiles into clear pathology signals.
OsteoPath AI demonstrates a three-class deep-learning workflow that distinguishes non-tumor tissue, non-viable tumor and viable osteosarcoma from histopathology images.
Powered with ❤️ by Solicitous ®
Slide triage console
Illustrative demo
Current tissue profile
Viable tumor
Viable tumor
94%
Non-viable tumor
4%
Non-tumor
2%
WHAT IS HAPPENING HERE?
A classification system, not a segmentation system.
The model receives a complete histology tile and assigns it to one predominant tissue category. It does not draw tumor boundaries pixel by pixel; instead, it learns visual patterns across the tile and produces class probabilities.
01
Read the tissue tile
A 10× H&E image tile contains color, cellular density, matrix structure, necrotic change and surrounding non-tumor anatomy.
02
Learn discriminative texture
EfficientNetV2 extracts progressively richer features—from stain edges and nuclei to larger tissue architecture.
03
Estimate three probabilities
The final classifier compares evidence for non-tumor, non-viable tumor and viable tumor, then ranks the likely class.
04
Support review
The predicted category can help organize large tile collections for expert review, quality control and research analysis.
ANIMATED DATASET THEATRE
See how the three tissue groups differ.
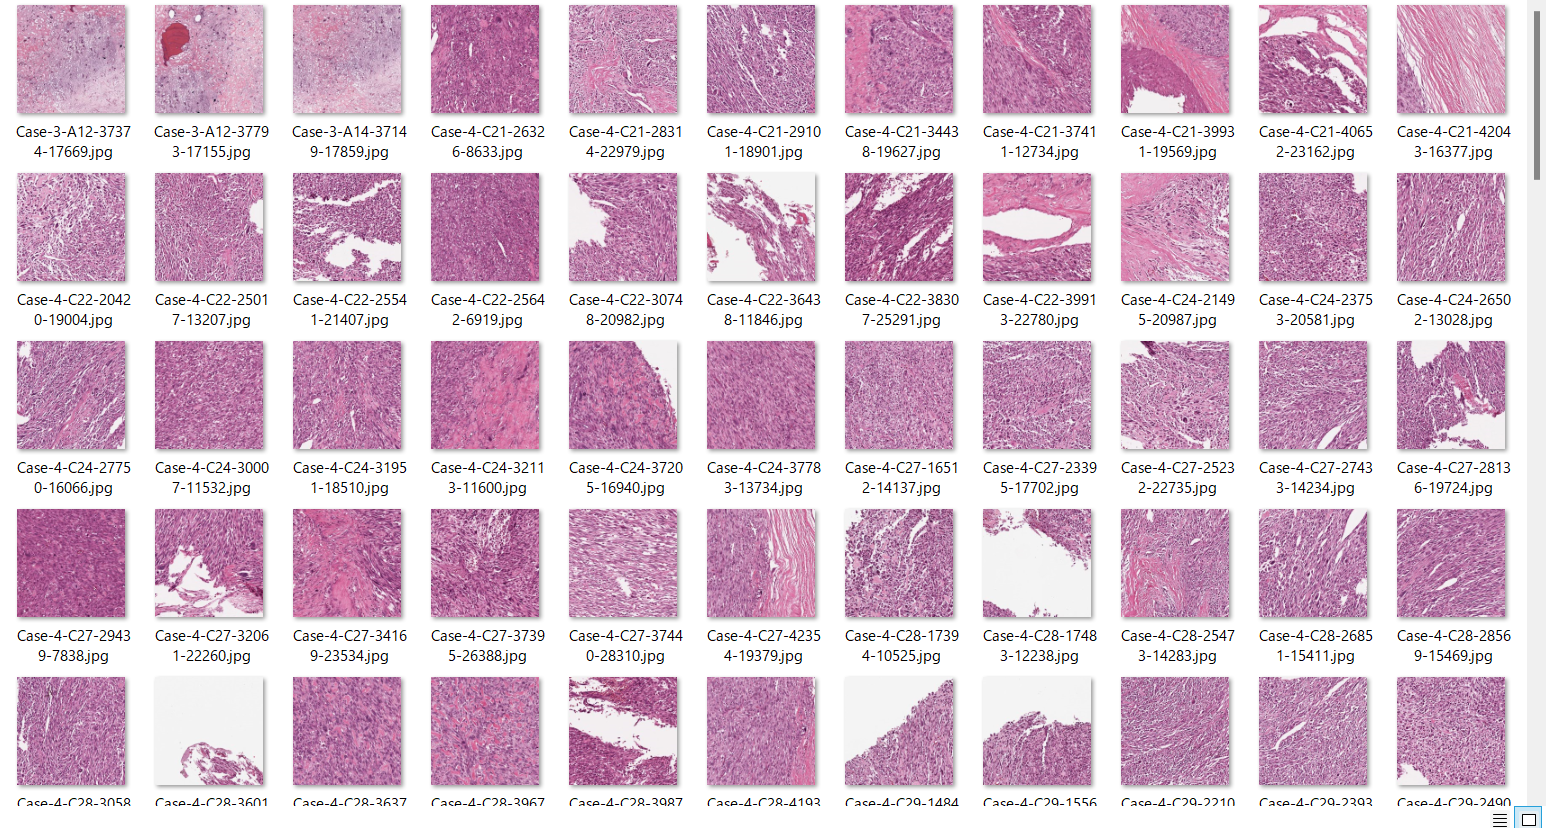
The viewer rotates through the project’s original dataset contact sheets. Every image is displayed with contain-fit framing so the entire scientific source remains visible.
AI feature scan
01/ 03
Viable tumor
Densely cellular malignant tissue with active tumor morphology and stronger hematoxylin-rich nuclear detail.
Class 01345 tiles
Viable tumor
Predominantly active tumor tissue. These tiles often show dense cellularity and viable malignant morphology.
30% of the complete datasetClass 02263 tiles
Non-viable tumor
Predominantly necrotic or treatment-affected tumor tissue with loss of viable cellular architecture.
23% of the complete datasetClass 03536 tiles
Non-tumor
Bone, marrow, fat and other tissue without predominant osteosarcoma morphology.
47% of the complete datasetMODEL WORKFLOW
From pathology tile to ranked tissue class.
The implementation fine-tunes an EfficientNetV2-M model rather than training every visual feature from zero.
01
H&E tile
Annotated 1024 × 1024 pathology image
02
Augmentation
Rotation, flips, shifts, shear and zoom
03
EfficientNetV2-M
Transfer learning with 40% trainable layers
04
Softmax scores
Three normalized class probabilities
05
Review output
Prediction, score and evaluation report
Training recipeFine tuning
- Backbone
- EfficientNetV2-M
- Training input
- 384 px
- Evaluation input
- 480 px
- Optimizer
- RMSprop
- Learning rate
- 0.0001
- Dropout
- 0.4
- Batch size
- 4
- Maximum epochs
- 50
Augmentation labRobustness
180° rotationhorizontal flipvertical flip20% shiftsshear 0.01zoom 0.1–3.0
Augmentation changes orientation and scale while preserving the tissue class, encouraging the network to learn morphology rather than memorizing one layout.
REPORTED EXPERIMENTAL RESULTS
Evaluation on 220 held-out images.
These figures reproduce the experimental report supplied with the project. They are not a prospective clinical validation.
200 correct predictions out of 220 test images
Average sensitivity across the three classes
Class-frequency weighted harmonic score
108 non-tumor · 53 non-viable · 59 viable
CONFUSION MATRIX
Rows: actual · Columns: predictedWhere predictions agreed—and where they did not.
Actual class
Non-tumor
Non-viable
Viable
Non-tumor
Non-viable
Viable
Predicted class
PER-CLASS PERFORMANCE
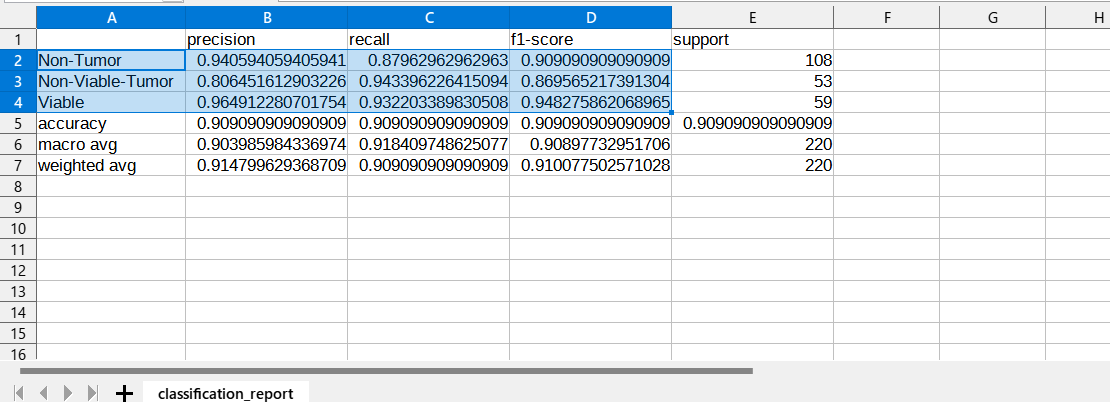
Precision, recall and F1
Non-tumor108 images
P94.1R88.0F190.9
Non-viable tumor53 images
P80.6R94.3F187.0
Viable tumor59 images
P96.5R93.2F194.8
Interpretation: viable tumor achieved the strongest F1 score, while non-viable tumor had the lowest precision because some other tissue tiles were predicted as non-viable.
ORIGINAL EXPERIMENTAL ARTIFACTS
Inspect the project’s training and evaluation evidence.
Full source image shown · no cropping
WHY THIS MATTERS
A practical demonstration for digital pathology workflows.
For instrument and laboratory presentations, the project shows how AI can sit downstream of slide scanning: ingesting exported image tiles, prioritizing tissue categories and presenting transparent confidence scores for human review.
01
Faster triageOrganize large image collections before detailed expert review.
02
Consistent categorizationApply the same learned decision function to every processed tile.
03
Instrument-ready storyConnect scanner output, AI analysis, review and reporting in one visual workflow.
04
Research extensibilityAdd attention maps, whole-slide aggregation, quality checks and case-level analytics.
Pipeline ready
tile ingestion     ✓
stain normalization ✓
feature extraction  ✓
class ranking       ✓
review package      ✓
OSTEOPATH AI
Return to top ↑
From stained tissue to structured insight.
A polished research presentation for AI-enabled pathology and laboratory instrumentation.
Research-use notice
This website presents an experimental image-classification workflow and reported retrospective results. It is not a medical device, does not replace pathologist review and must not be used for diagnosis or treatment decisions without appropriate validation, governance and regulatory approval.