From grayscale scan to anatomical map
The system converts dense OCT textures into interpretable retinal regions, helping the audience understand where layers begin, end, and change across a macular scan.
 OcuLayer AIRetinal intelligence platform
A presentation-ready retinal OCT intelligence experience for segmenting anatomical layers and fluid-related regions with fast, consistent visual interpretation.
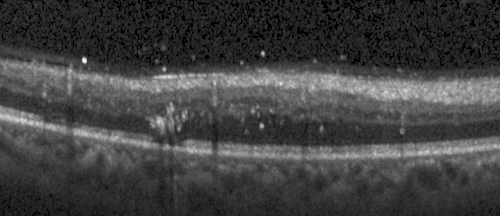
The system converts dense OCT textures into interpretable retinal regions, helping the audience understand where layers begin, end, and change across a macular scan.
Pixel-wise segmentation presents the retina as distinct anatomical bands rather than an undifferentiated image.
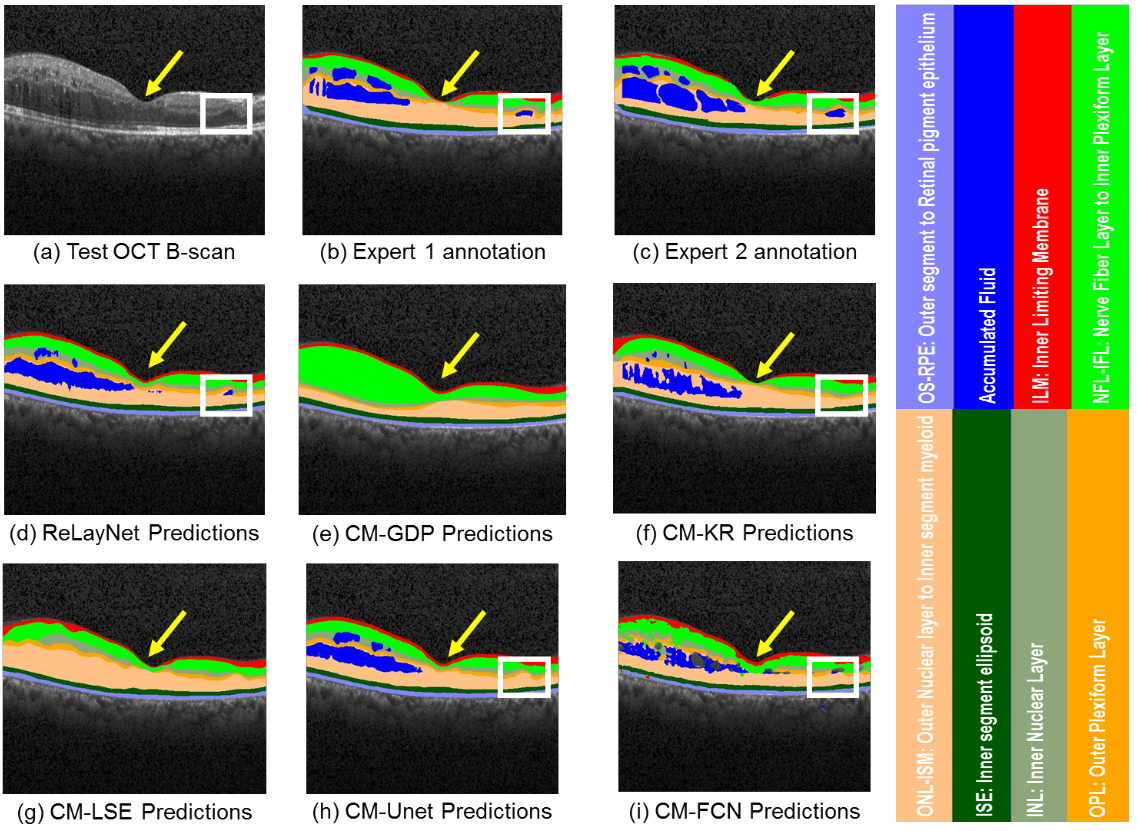
Colored regions make pathological spaces visually apparent and easier to compare with expert annotation.
Consistent output supports faster scan review, training demonstrations, and structured research workflows.
Move through eleven B-scans surrounding the foveal center. The viewer preserves the entire source image, adds a scanner beam, and lets you pause or inspect individual frames.
A carefully structured encoder-decoder workflow transforms a noisy B-scan into pixel-wise retinal labels while retaining fine anatomical boundaries.
Load an OCT B-scan and standardize its spatial format.
Reduce speckle while protecting clinically important edges.
Extract multi-scale texture, boundary, and context features.
Restore spatial detail and predict dense class probabilities.
Display retinal layers and fluid regions as a color map.

Each color represents a different anatomical or pathological region. Hover or tap a label to spotlight its corresponding band in the stylized retinal map.
Repository visuals are displayed at their full aspect ratio with contain-fit framing so no anatomical detail or label is cropped.
The panel brings the test B-scan, two expert annotations, the AI prediction, and several comparative methods into a single presentation-ready view.
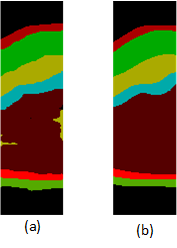
The side-by-side masks highlight boundary agreement and visible class differences.
A polished visual story for clinical demos, instrument presentations, research discussions, and AI capability showcases.
Color-coded anatomy is easier to discuss than raw prediction arrays or abstract model architecture.
The scan-to-insight workflow naturally complements OCT systems and ophthalmic imaging portfolios.
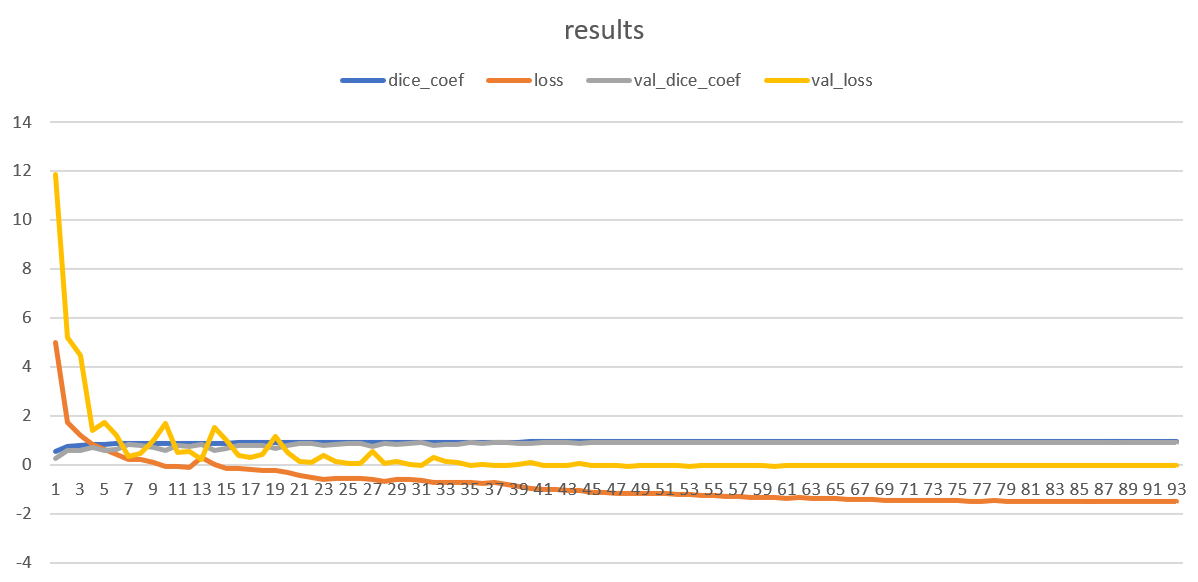
Expert labels, predictions, loss curves, and side-by-side comparisons remain visible in one coherent presentation.
All images, controls, animations, and brand assets are stored locally for dependable client presentations.
Explore retinal layers, fluid regions, expert comparisons, and model behavior in one presentation experience.