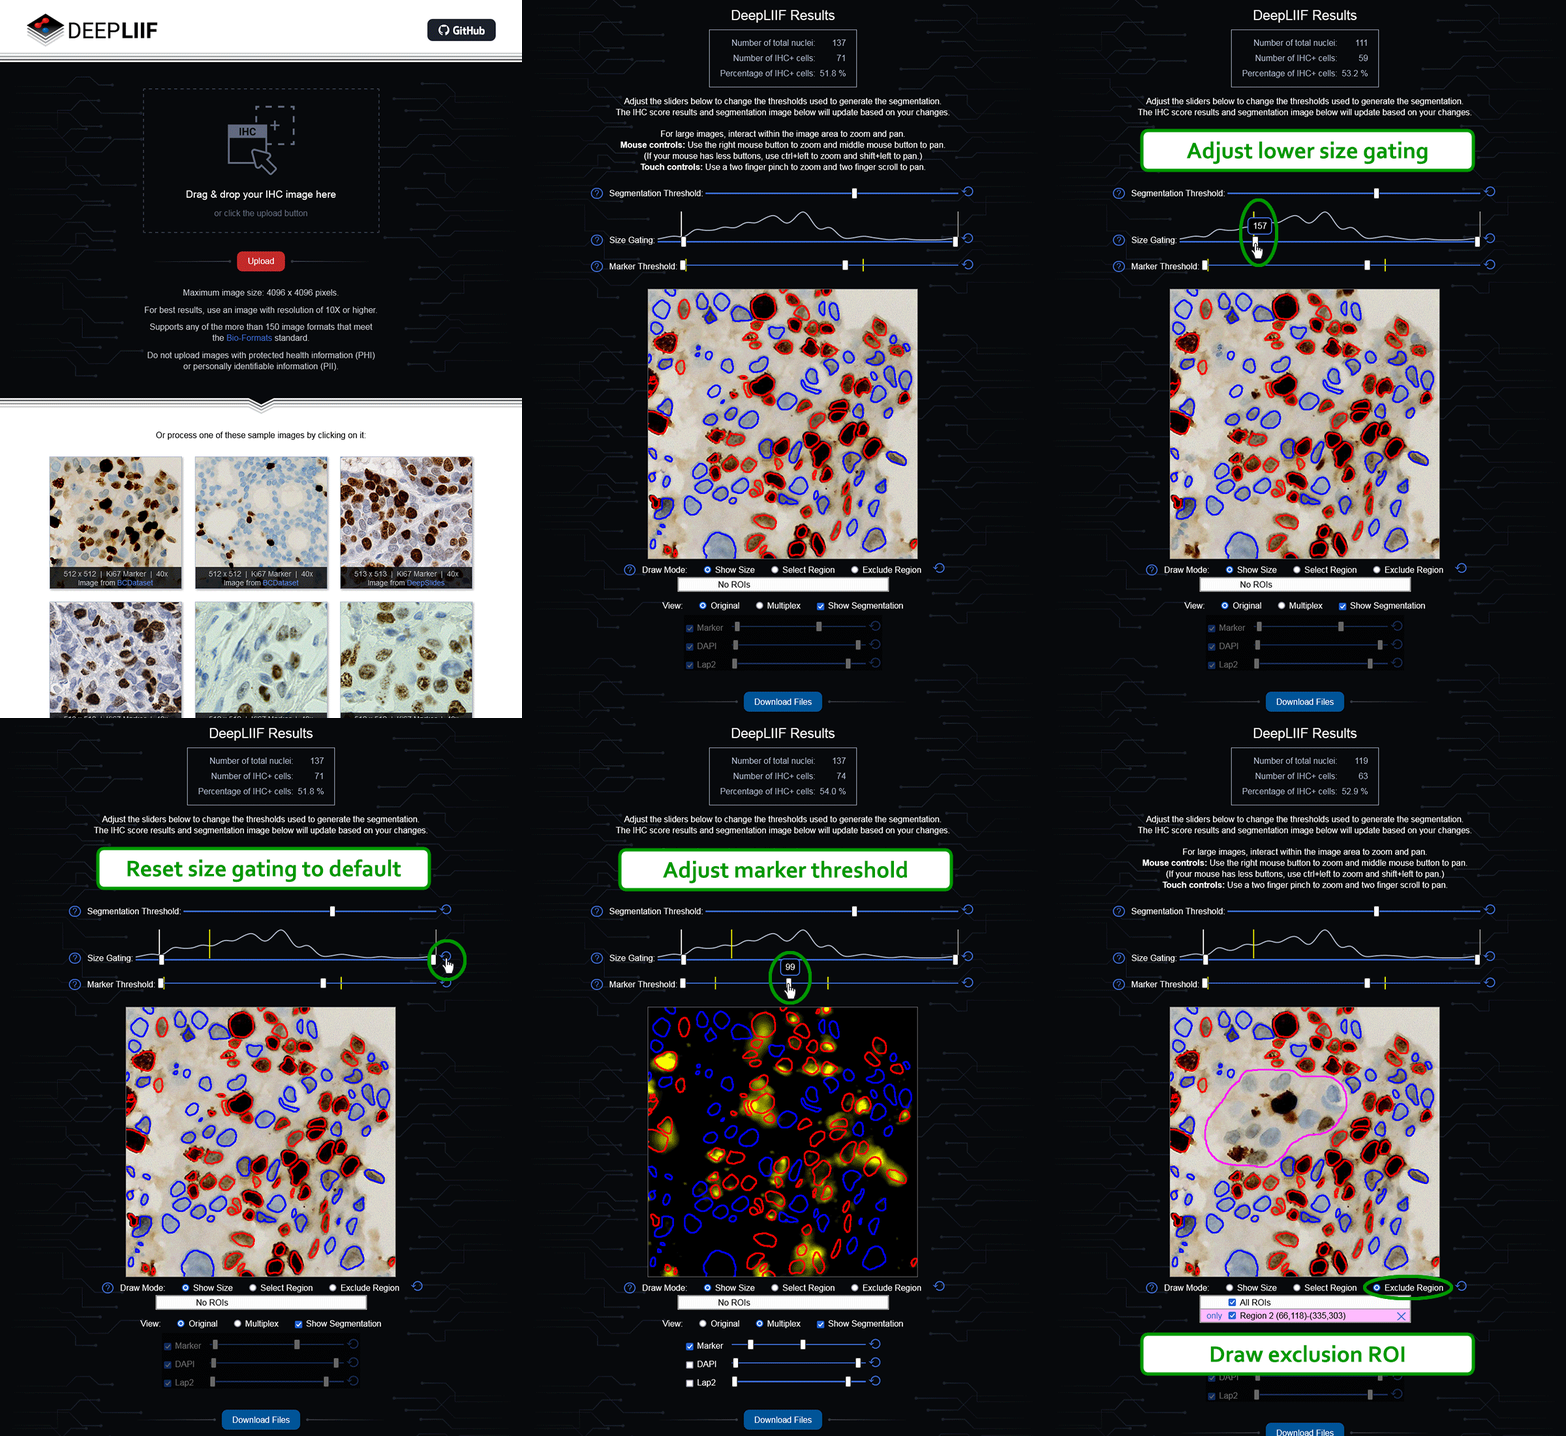
Interactive analysis workspace
Upload, process, inspect and refine segmentation and scoring results through an accessible visual interface.
A next-generation computational pathology platform that transforms routine immunohistochemistry images into interpretable multiplex channels, cell-level segmentation, and quantitative biomarker scoring.
The multitask pipeline performs virtual stain separation, inferred fluorescence generation, nuclear segmentation, positive/negative cell classification, and quantitative scoring in a unified workflow.
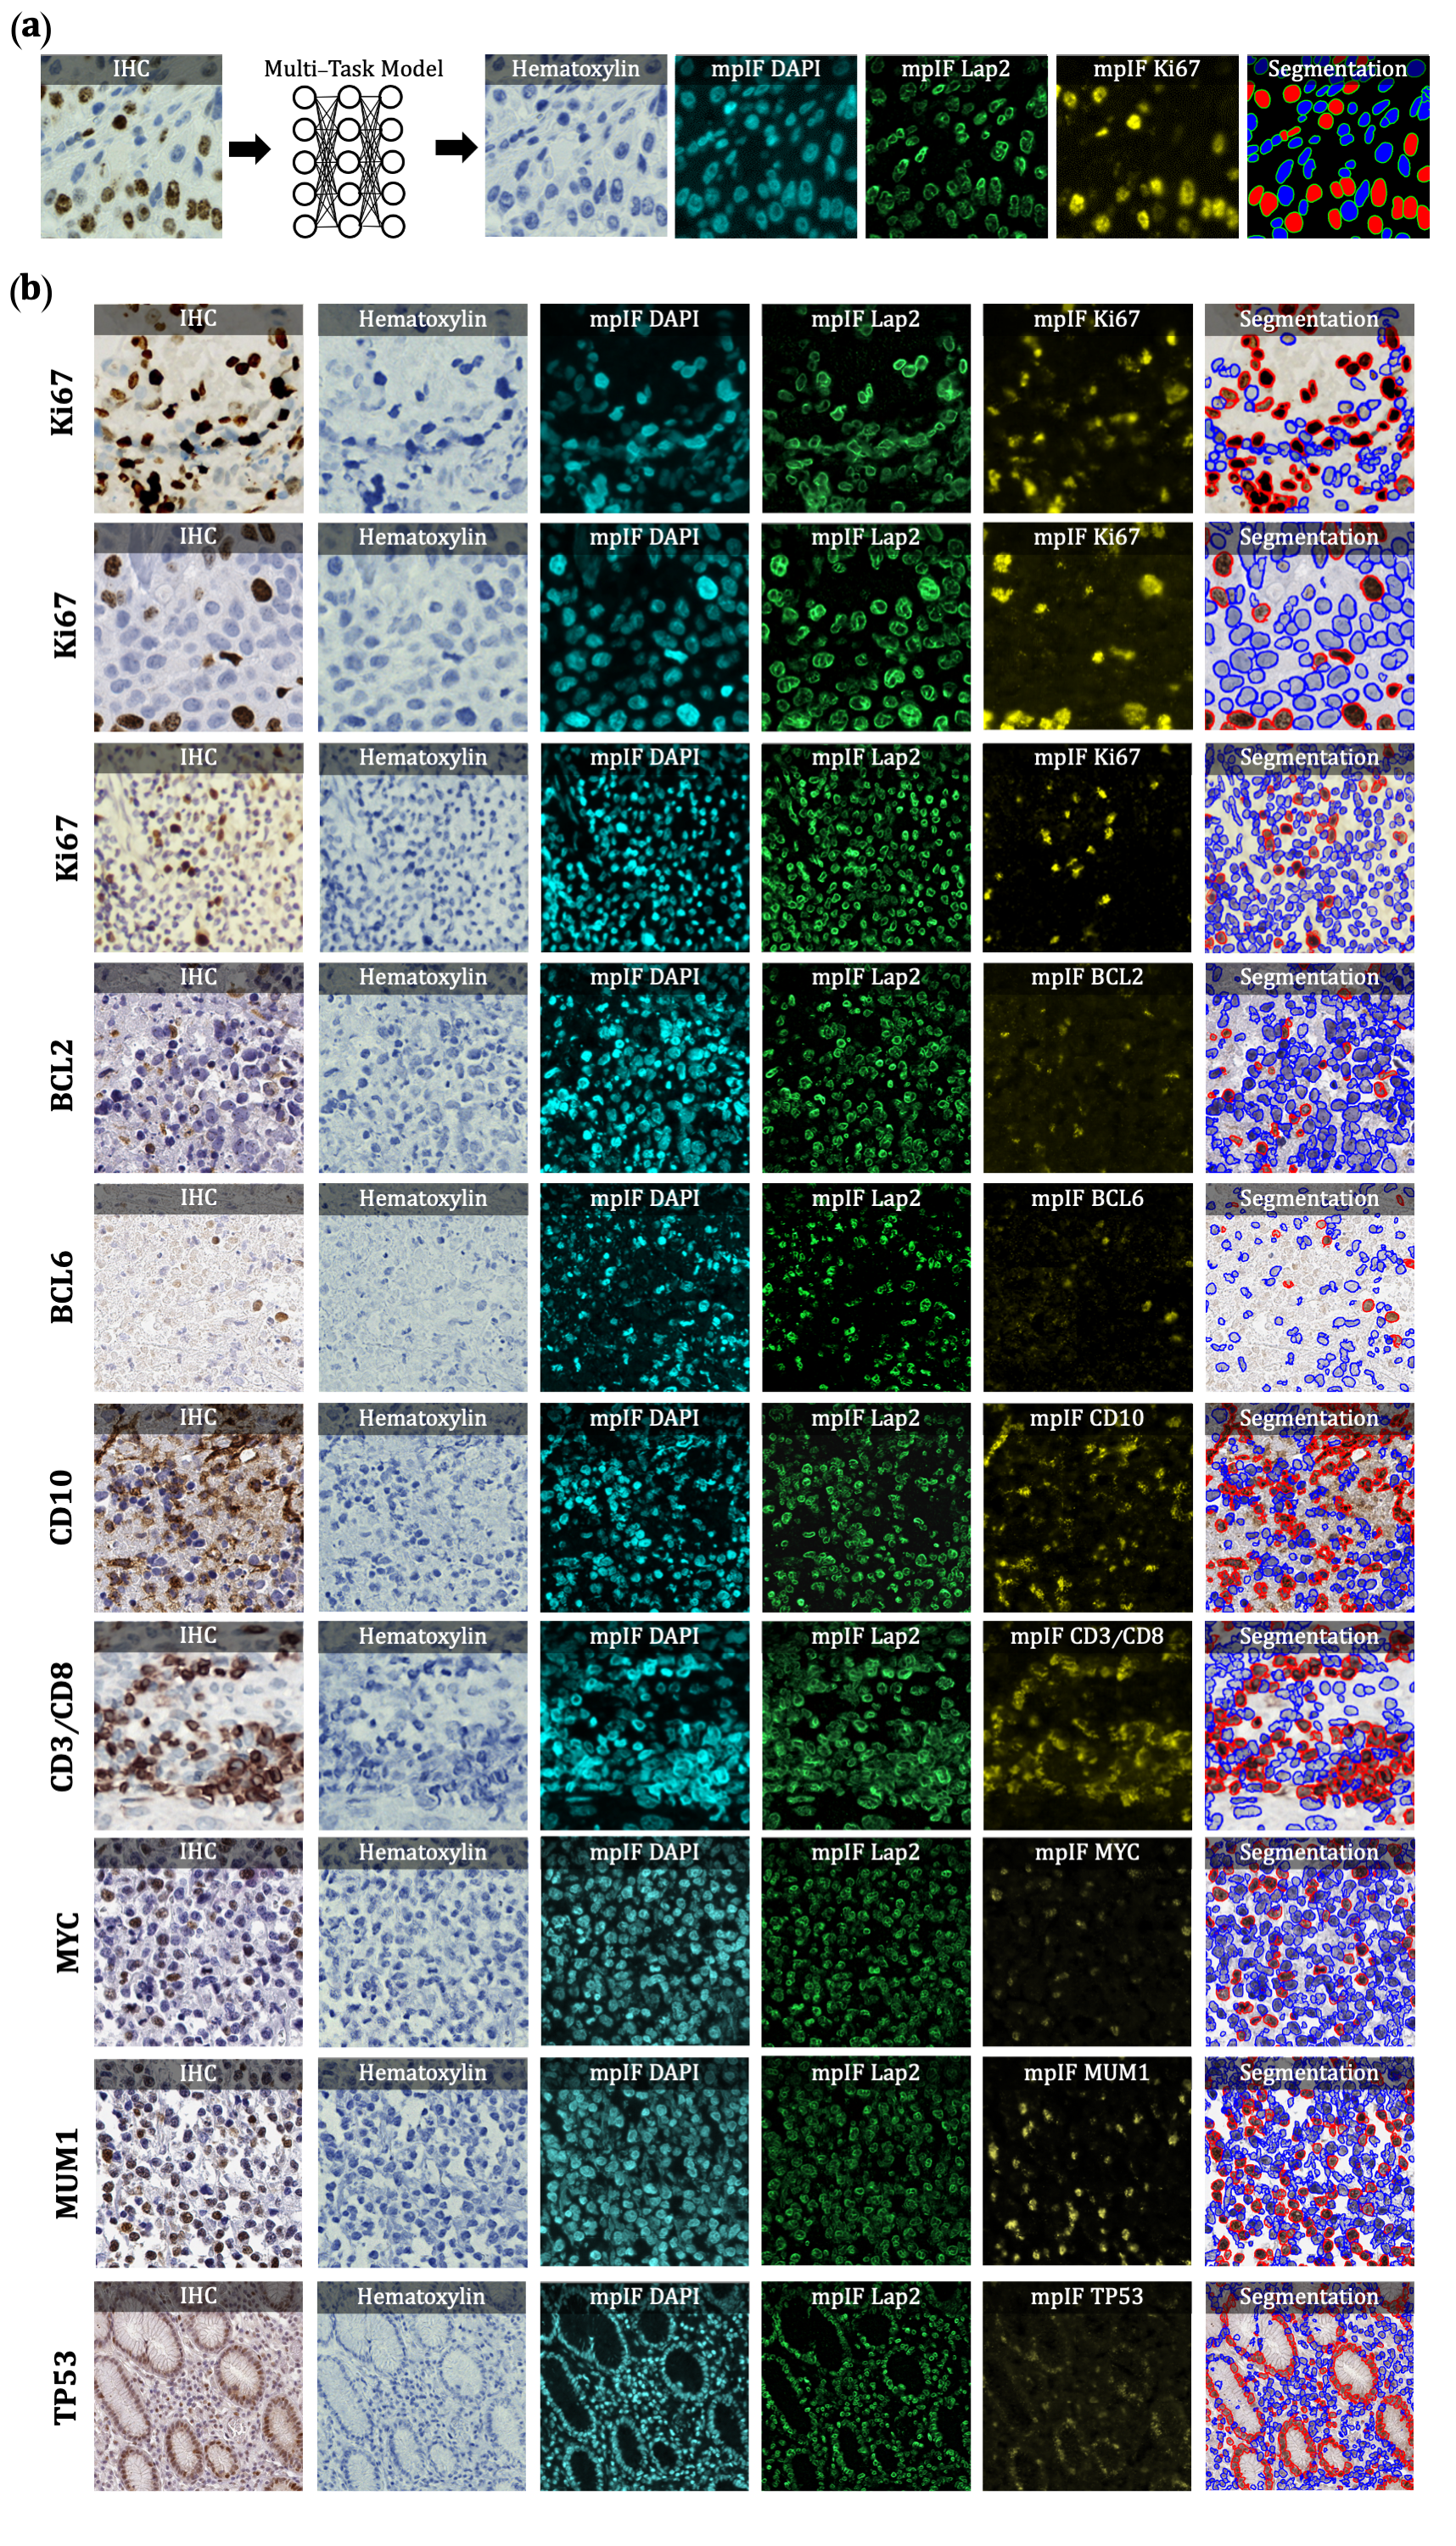
IHC input is translated into hematoxylin, DAPI, nuclear-envelope, protein-marker and classified segmentation views.
Load routine brightfield IHC imagery from a microscope, camera or slide scanner.
Infer cleaner hematoxylin and biomarker representations without manual deconvolution.
Generate virtual multiplex immunofluorescence channels for interpretable analysis.
Delineate touching and overlapping nuclei and classify positive versus negative cells.
Calculate total nuclei, positive-cell count and biomarker positivity percentage.
Large-format result imagery and animated workflows make the underlying pipeline easy to explain to clinical, scientific and business audiences.
Upload, process, inspect and refine segmentation and scoring results through an accessible visual interface.
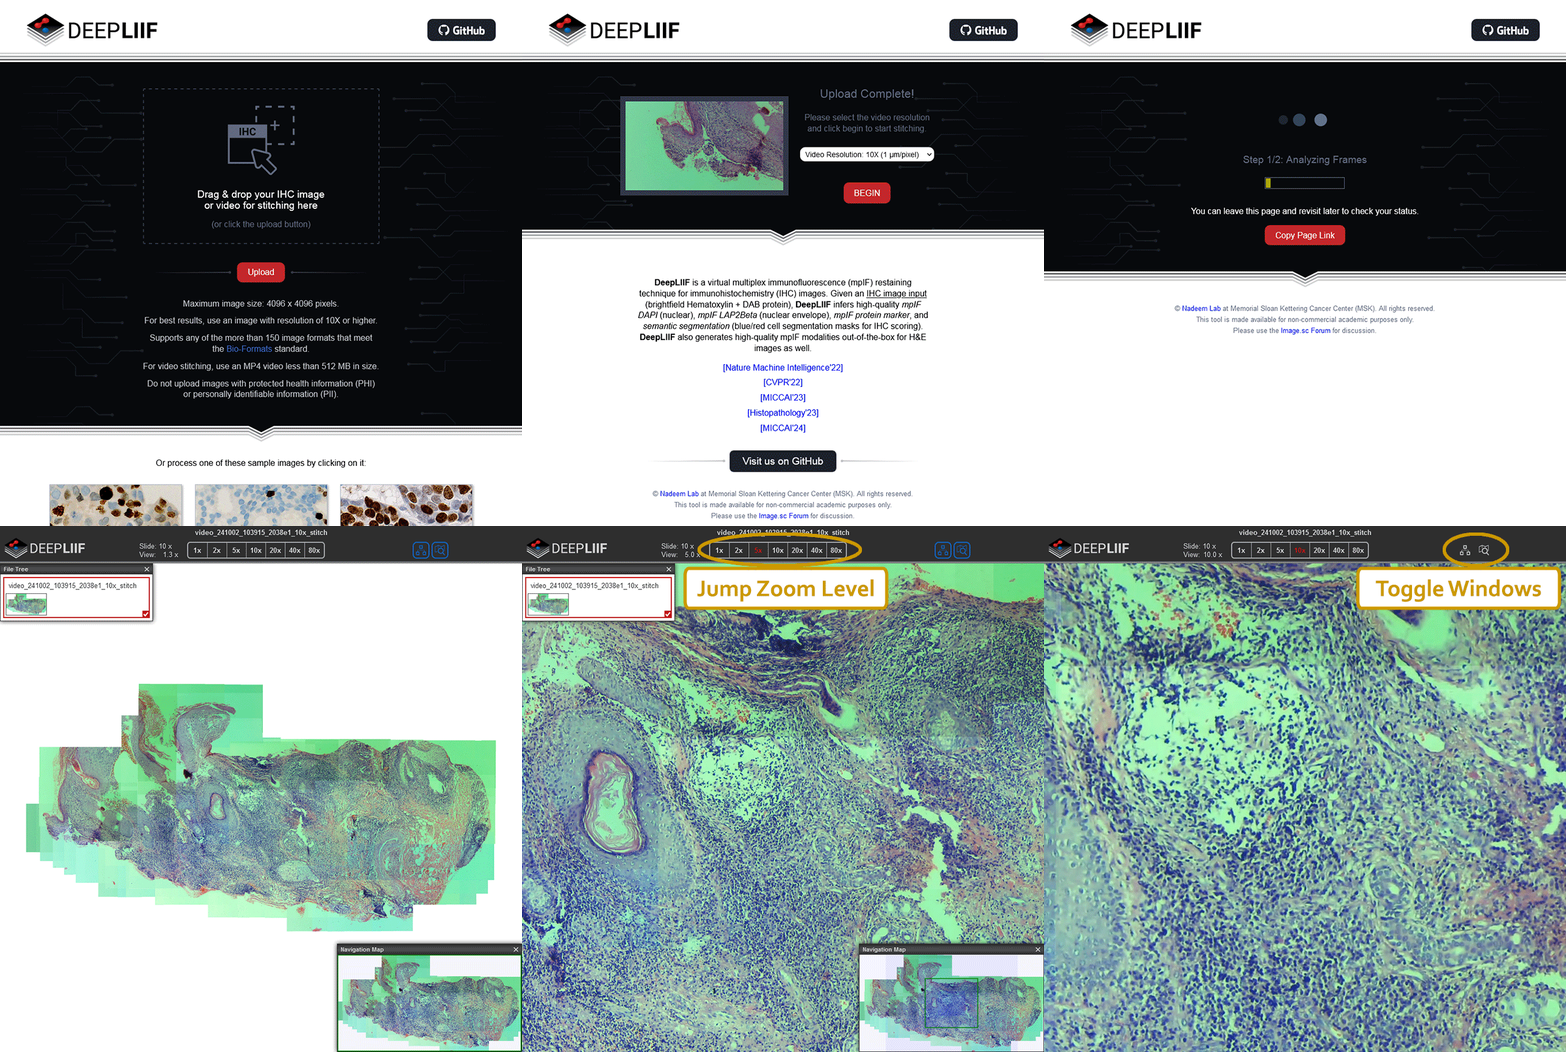
Convert a captured microscope sweep into a navigable digital tissue view for low-resource digitization workflows.
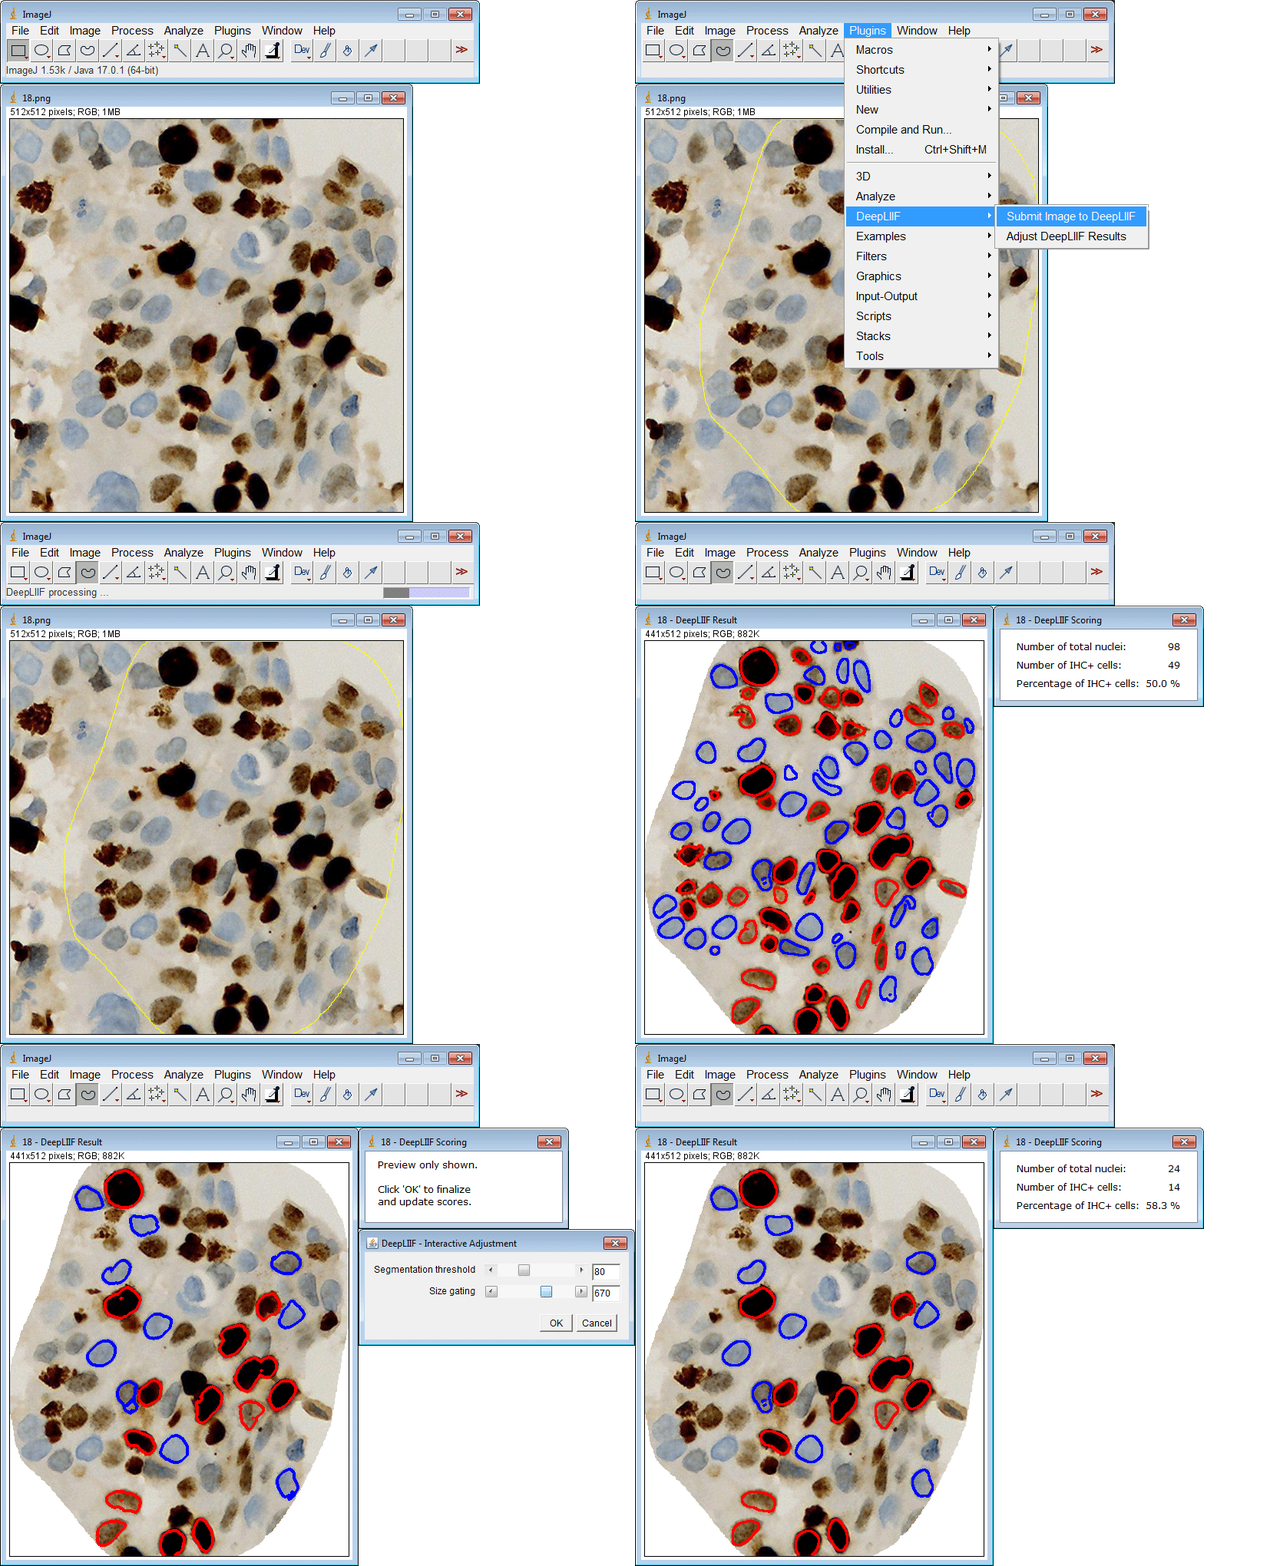
Bring AI inference into established pathology and image-analysis workflows.
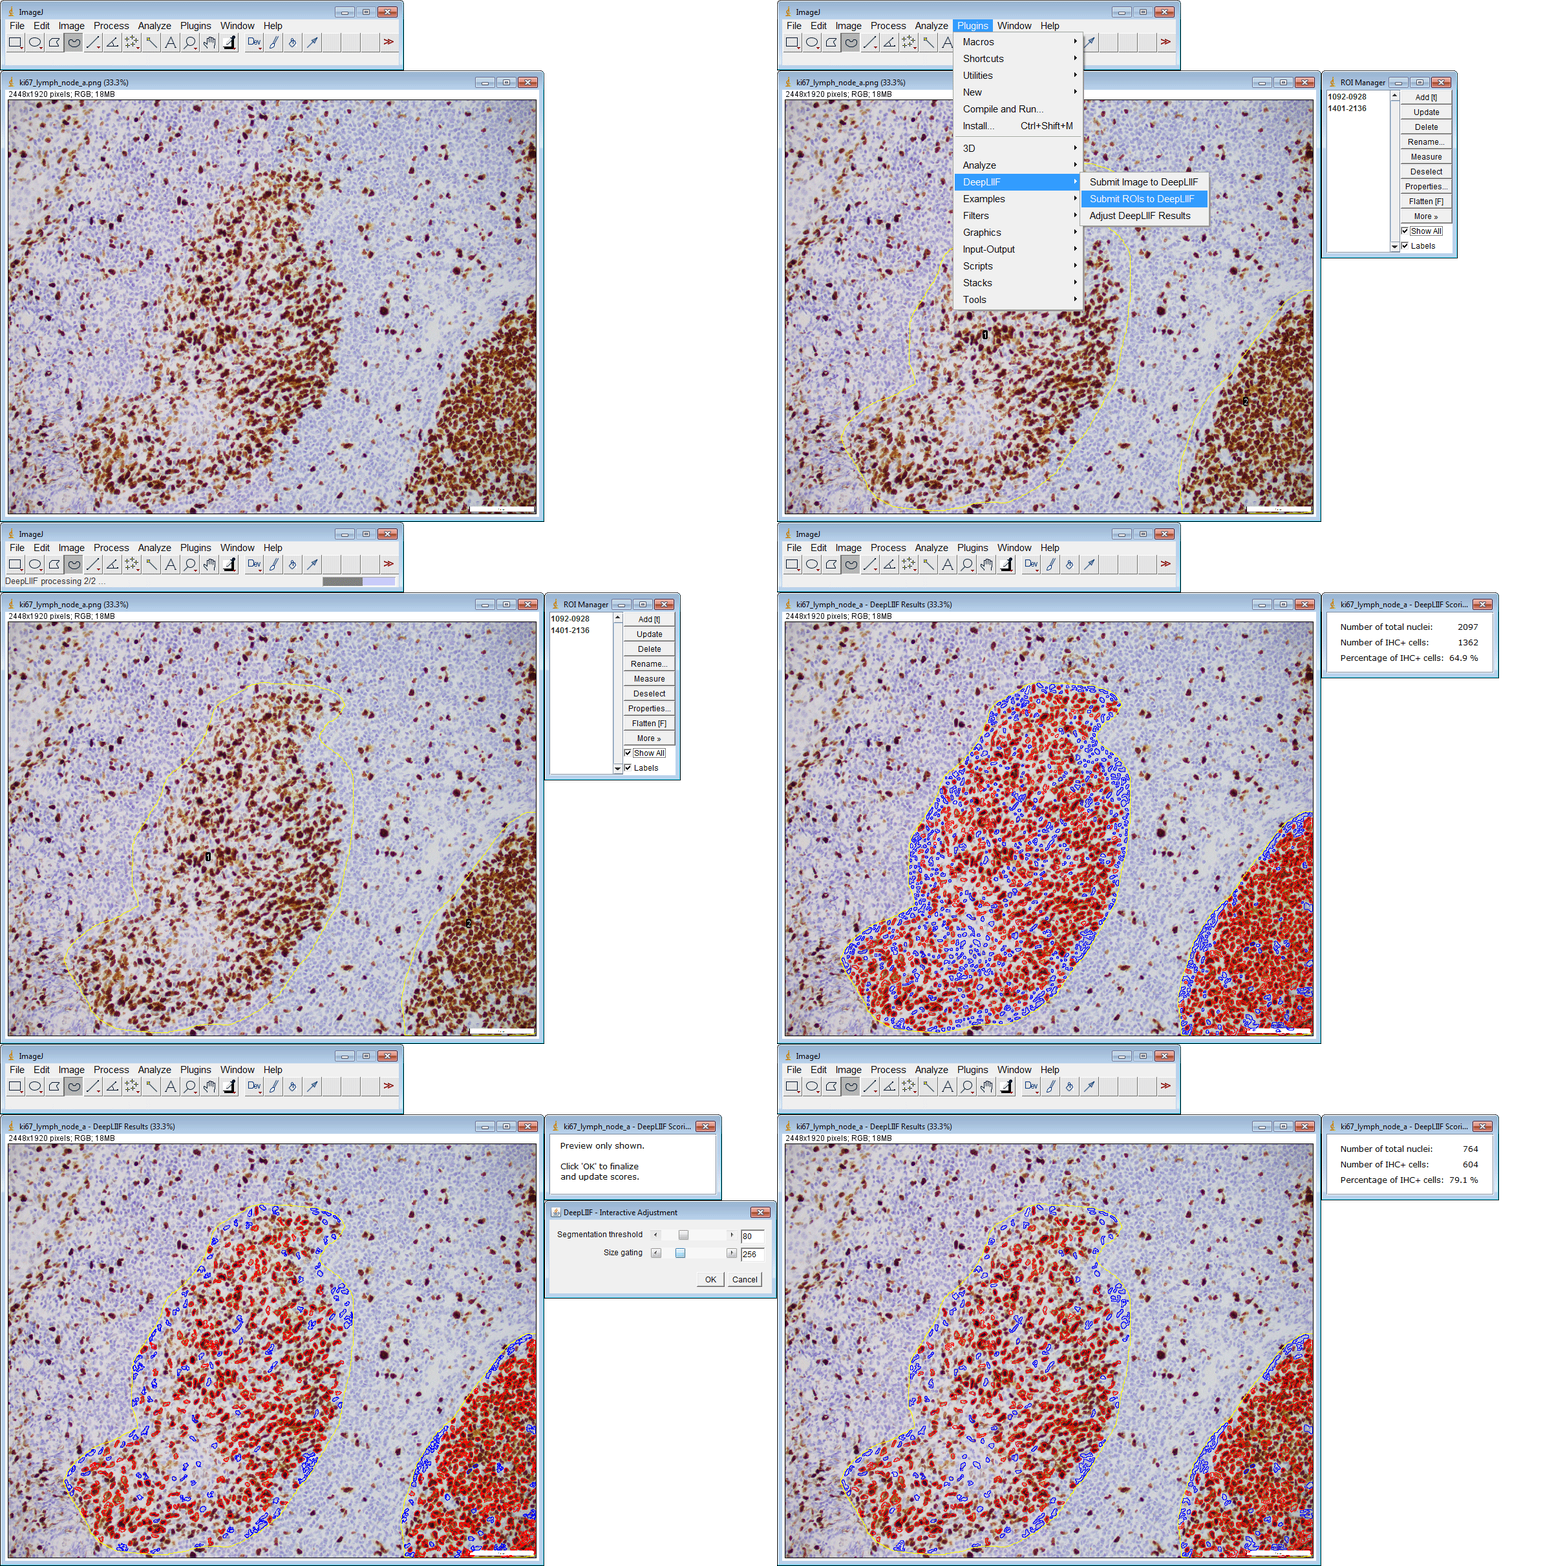
Select focused tissue regions and run targeted cell segmentation and biomarker quantification.
The system can support noisy tissue images and multiple nuclear or cytoplasmic markers, while preserving interpretable intermediate channels for review.
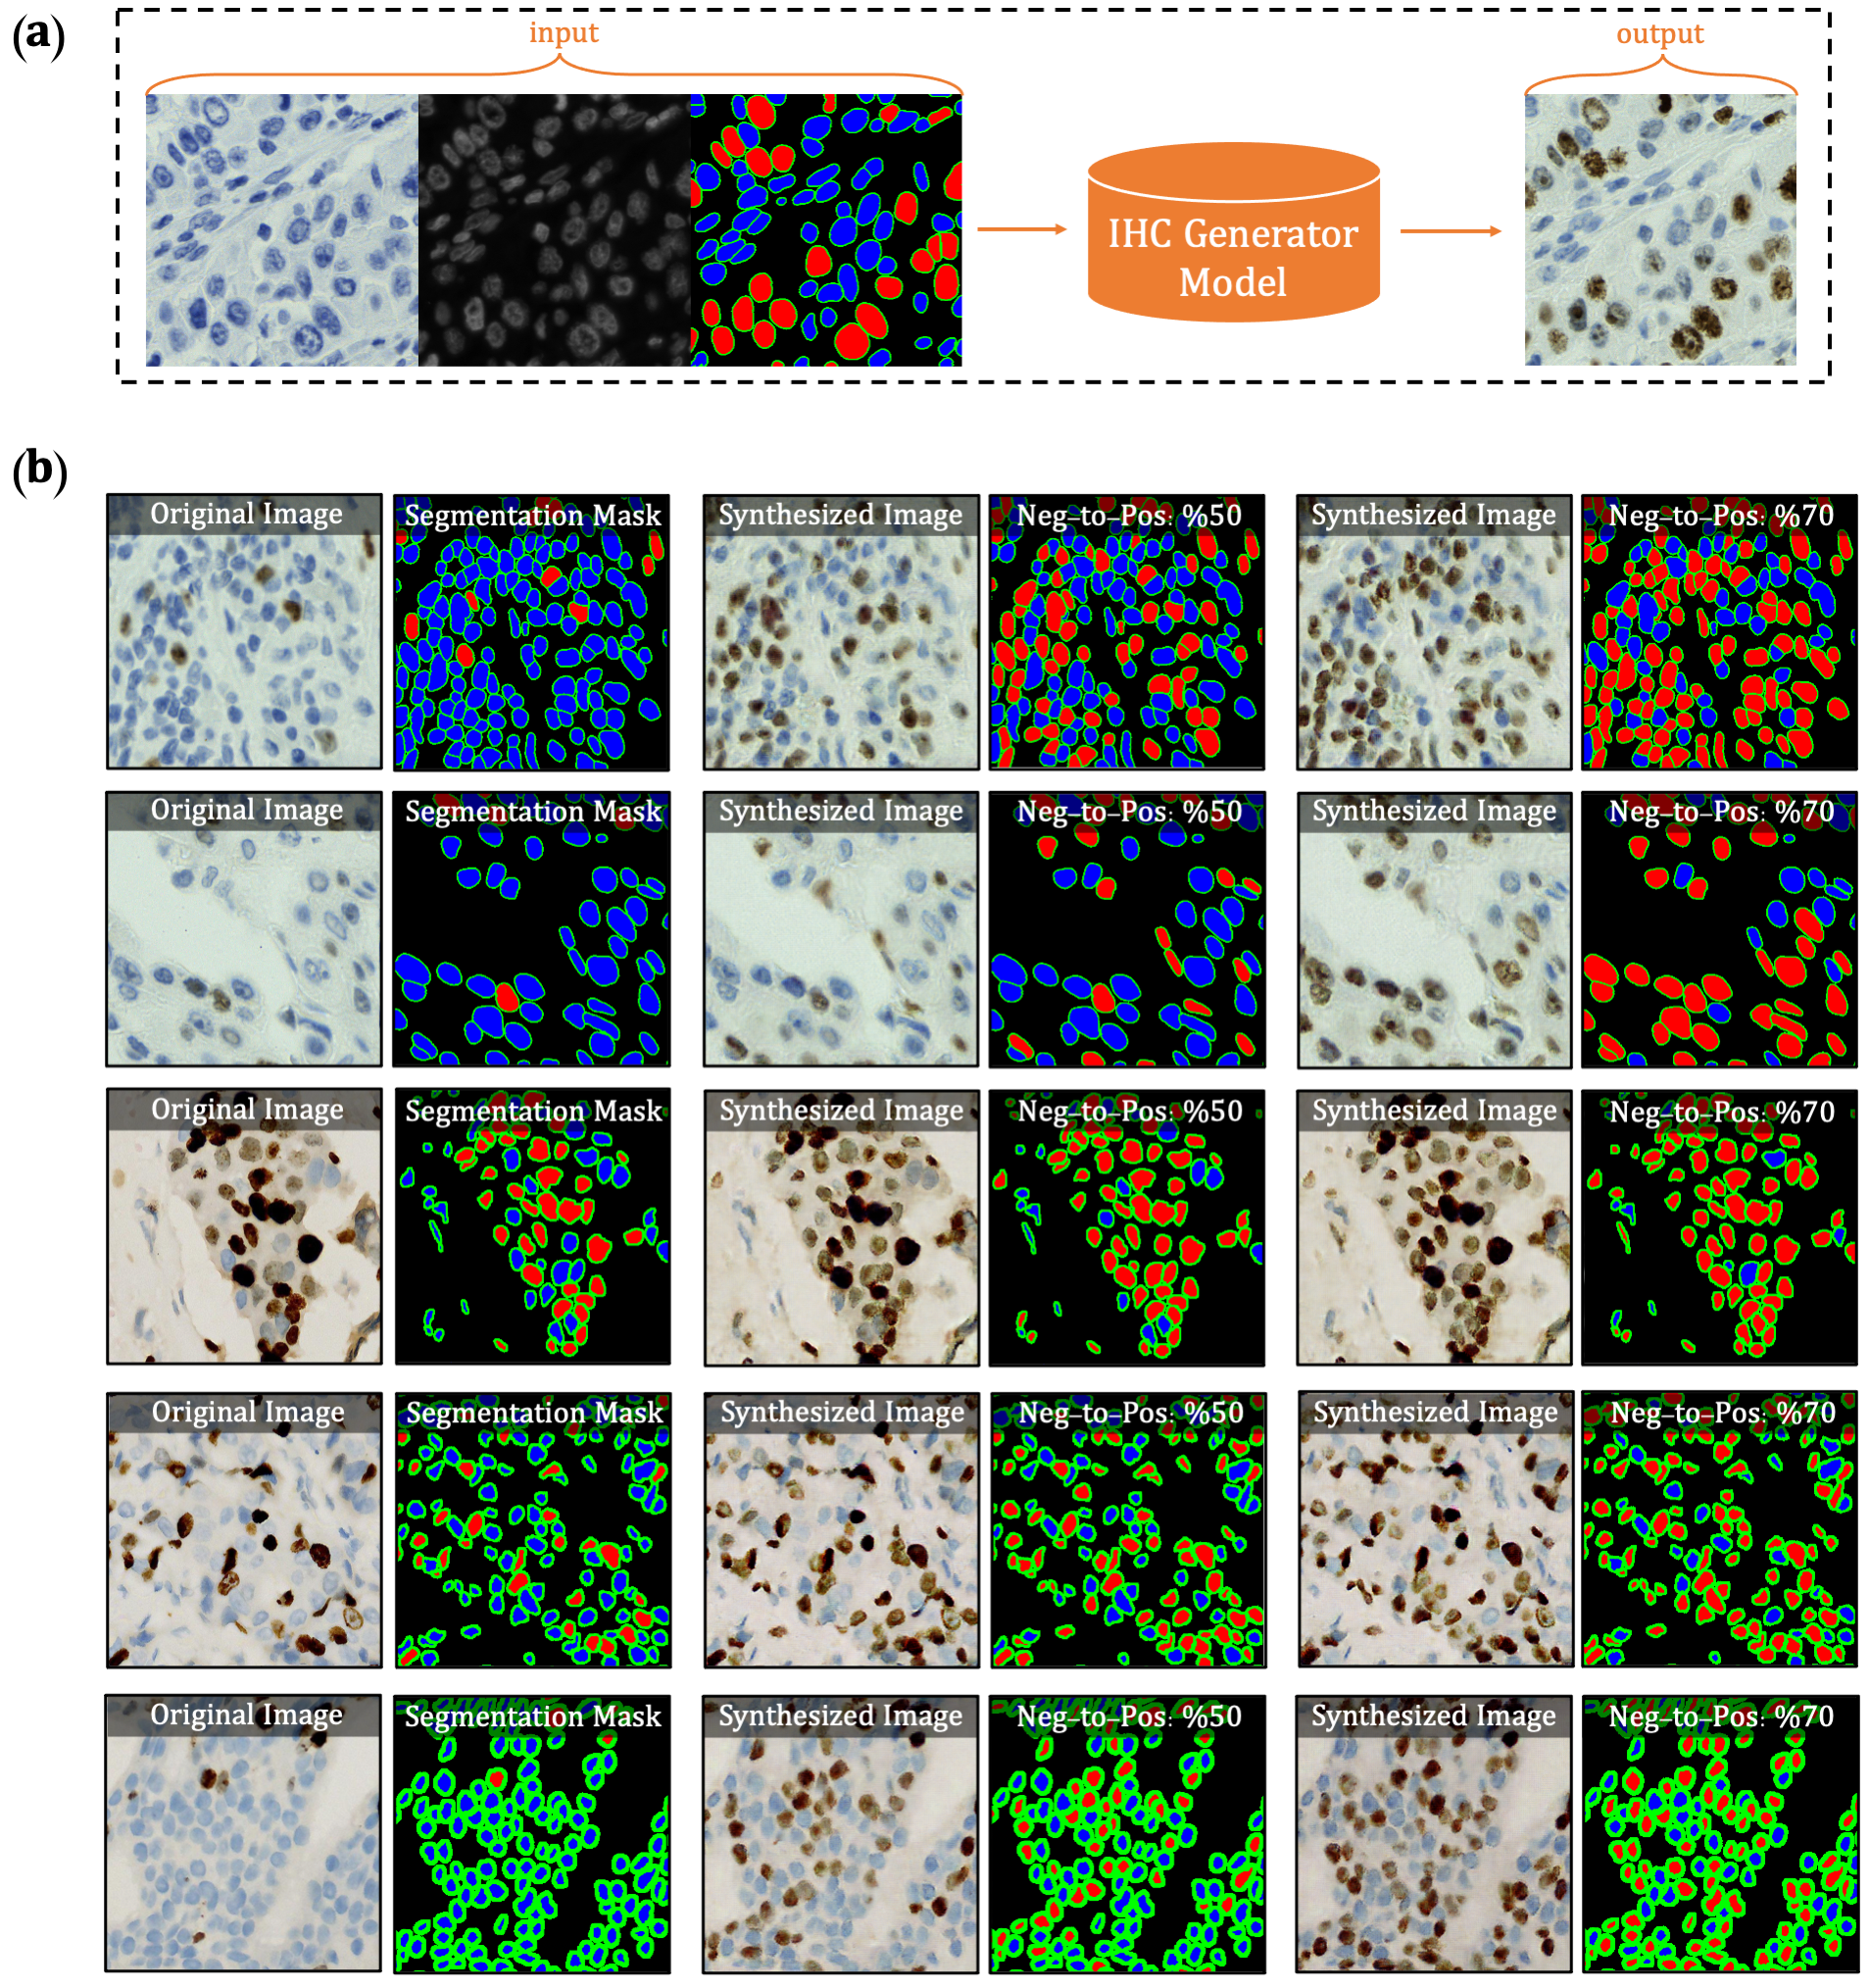
Segmentation-guided synthesis introduces challenging positive-cell clusters for stronger training coverage.

A premium, presentation-ready experience for demonstrating AI-assisted stain translation, cell segmentation and biomarker scoring.